

While few are talking about it, America’s debt crisis is perhaps the most important issue out there now and for future generations.
The United States has crossed $40 trillion in gross federal debt, bond investors around the world are demanding the highest yields in a quarter century, and the political class is behaving as if nothing is wrong. Too harsh? Read on and you will see why this is perhaps the most important issue facing voters this election cycle. I believe a fiscal reckoning is on the horizon. The warning signs are clear from a series of bond events we have just witnessed.
A budget director’s vantage point.
As a former state budget director and management secretary, I have spent a career reading budgets the way a physician reads a medical chart: looking past the headline number to the underlying vital signs. A state, unlike Washington, D.C, cannot print money, cannot borrow without limit, and must balance its operating budget. That is what I had to do on many occasions, for example when revenue suddenly dropped when the dotcom bubble burst. That discipline sharpens the eye. When I look at the federal government’s finances today, the vital signs are alarming, and they are occurring in a period of relative economic expansion, which is precisely when they should be at their best.
I have written on this subject before. I return to it now because the bond market has begun to say, loudly and across continents, what budget analysts have said for years. The question is no longer whether the enormity of our debt will impact interest rates. The market is now pricing it in.
I write about it in this healthcare forum as well because the nation’s fiscal health is directly tied to how much it can invest over time in Americans’ physical health. As you will see below, part of our nation’s debt picture includes huge unfunded liabilities for healthcare, driven by a healthcare system that borders on the dysfunctional and in need of fundamental reform.
What does $40 trillion in debt mean?
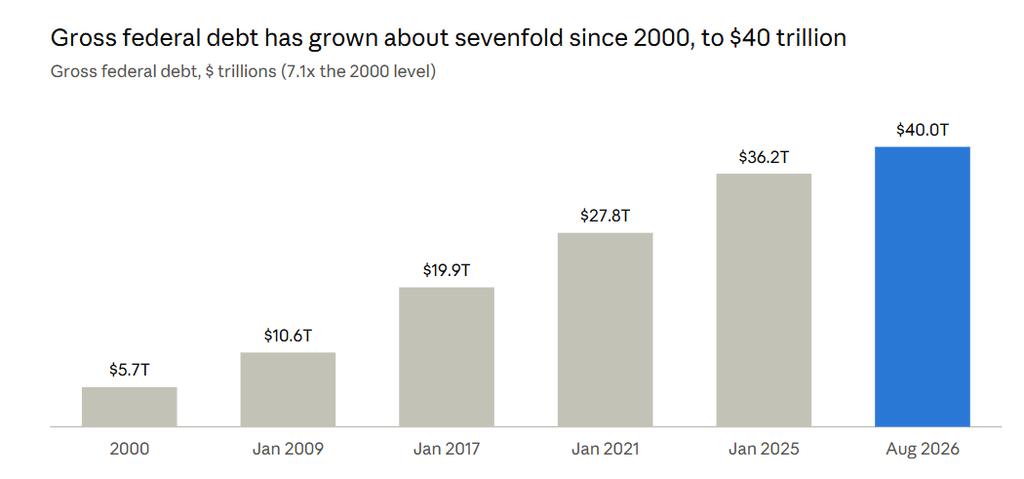
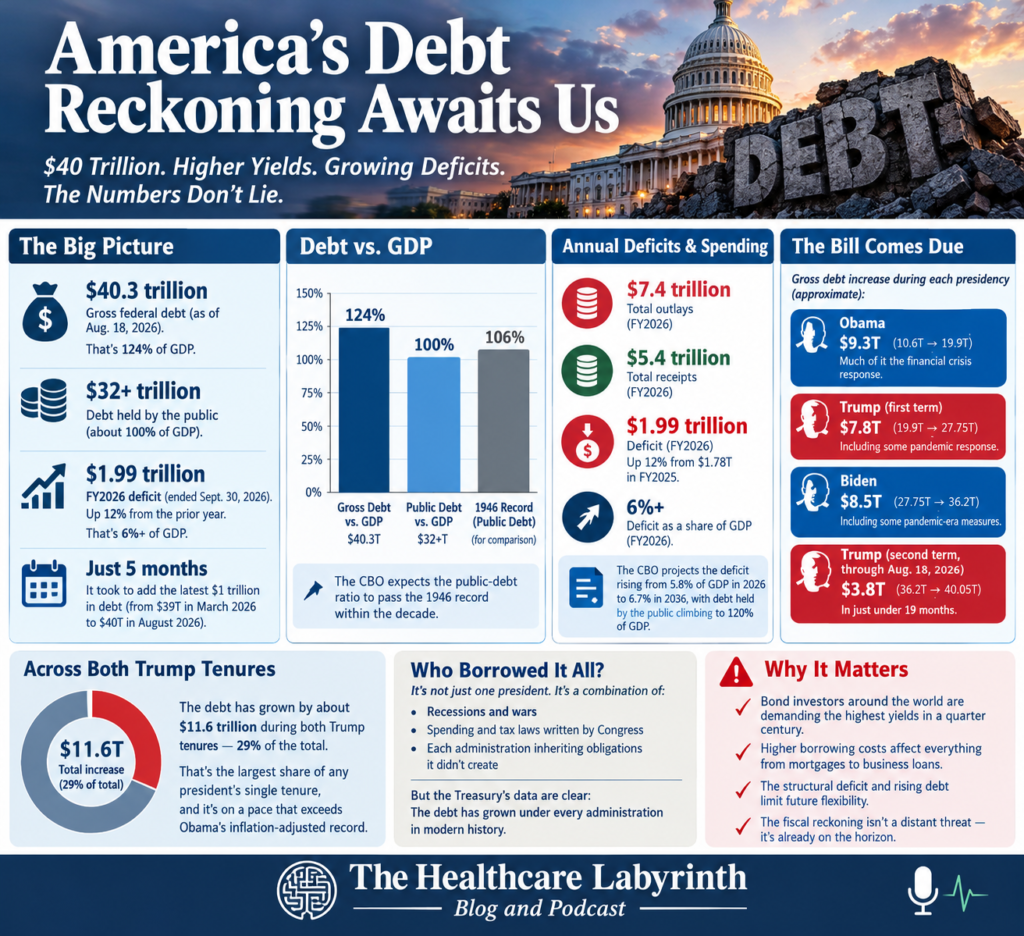
The Treasury reported that gross national debt passed $40 trillion on August 18, 2026. It reached $38 trillion in October 2025 and $39 trillion in March 2026. The most recent trillion took just five months to accrue. Debt held by the public, the portion owed to outside investors, stands above $32 trillion, about 100% of gross domestic product (GDP). The balance is intragovernmental debt, owed by the Treasury to trust funds such as Social Security. For context, gross debt was about $5.7 trillion in 2000.
Set against the economy, gross federal debt of $40.3 trillion is roughly 124% of GDP, and debt held by the public is about 100%, closing in on the 106% record set in 1946. The Congressional Budget Office expects the public-debt ratio to pass that record within the decade. These are astounding numbers.
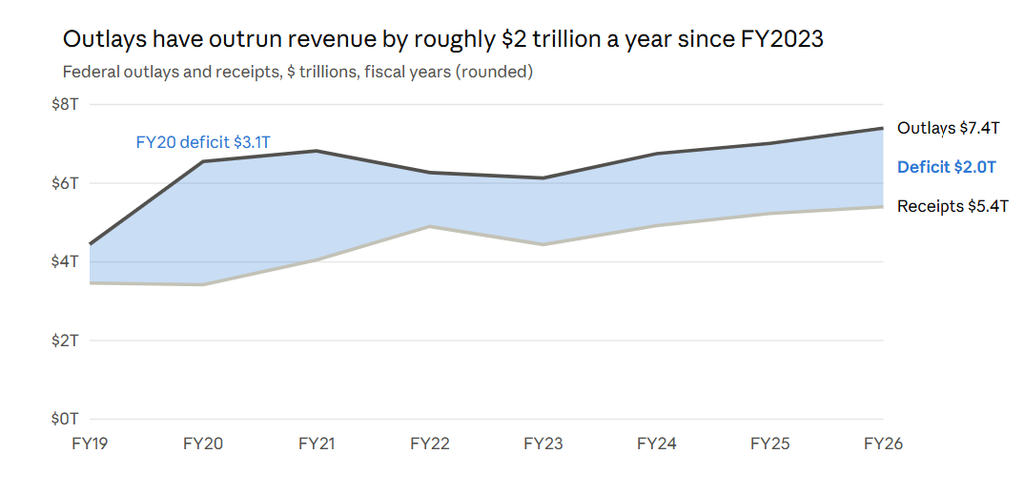
Driving all this is of course deficit spending. Final Treasury figures show that fiscal year 2026, which ended September 30, closed with a deficit of $1.99 trillion, up 12% from $1.78 trillion a year earlier. Outlays were about $7.4 trillion against receipts of about $5.4 trillion. That is the fourth consecutive year with a deficit near $2 trillion, and it equals over 6% of GDP. Complicating all this is the fact that the Supreme Court ruled against many of the administration’s tariffs and forced refunds of roughly $145 billion. Further, the Iran conflict has added defense and energy-price pressures. But neither changes the structural picture. Spending grew 6% while revenue grew 3%.
The CBO’s February baseline projects the deficit rising from 5.8% of GDP (it has a slightly lower figure) in 2026 to 6.7% in 2036, and debt held by the public climbing from about 101% of GDP to 120%, surpassing the 106% record set in 1946 at the end of the Second World War. That earlier peak followed a global war. The coming one follows no real emergency at all, save for the earlier COVID pandemic.
Who borrowed it all?
Debt belongs to no single president. Congresses write the spending and tax laws, recessions and wars intervene, and each administration inherits obligations it did not create. Still, voters are entitled to know what happened on whose watch, and the Treasury’s own data are unambiguous. Measured as the change in gross debt while in office, and rounding for clarity:
- Obama: from $10.6 trillion to $19.9 trillion, an increase of about $9.3 trillion, much of it the response to the financial crisis.
- Trump, first term: from $19.9 trillion to $27.75 trillion, an increase of about $7.8 trillion, including some pandemic response.
- Biden: from $27.75 trillion to $36.2 trillion, an increase of about $8.5 trillion, also including some pandemic-era measures.
- Trump, second term through August 18, 2026: from $36.2 trillion to $40.05 trillion, an increase of about $3.8 trillion in under nineteen months.
- Others:
- George W. Bush: roughly $4.9 trillion.
- Clinton: roughly $1.6 trillion, the only modern presidency to see the debt-to-GDP ratio fall meaningfully. Many give a GOP Congress starting in 1995 credit for the fiscal belt-tightening.
- Reagan and George H.W. Bush together: roughly $3.3 trillion.
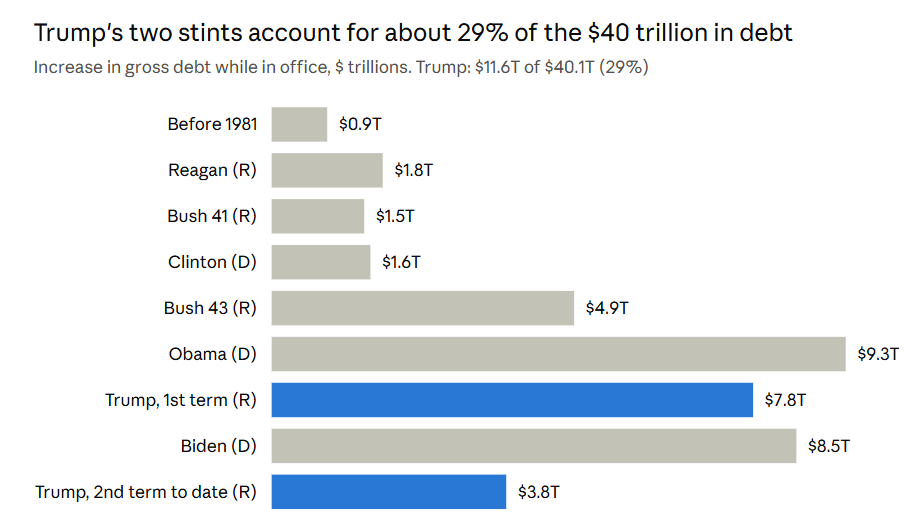
Across both Trump tenures, the debt has grown by about $11.6 trillion, which is about 29% of the total. That is the largest share of any president measured by a single person’s tenure, and it is on a pace that exceeds Obama’s inflation-adjusted record.
And that share for Trump is going to rise due to the tax cuts that were continued in law with insufficient budget cuts and a waiver of the baseline requirements. A rough assumption for the next two plus years (using the CBO baseline deficits) is that deficits will be about $1.9 trillion in fiscal 2027, a little over $2 trillion in fiscal 2028, and roughly $0.5 trillion for the first quarter of fiscal 2029 (the rough end of Trump’s term). That brings gross debt to about $44.7 trillion when Trump exits. The second term would then have added about $8.5 trillion to the $36.2 trillion inherited in January 2025. Combined with the first term’s $7.8 trillion, Trump’s tenure would account for about $16.3 trillion, or roughly 36%, up from 29% today.
CBO’s published path says it will be $43.3 trillion by the end of 2028, which would put the share nearer to 34%. That is likely low given Congress’ and Trump’s spending prowess. And the CBO’s numbers assume current law and do not include the Iran conflict, the tariff refunds, and the surge in bond yields. Its August update to tariff policy alone adds $0.9 trillion to deficits from 2027 to 2036. Actual debt already sits above the path CBO projected for the end of fiscal 2026, which is why I think my figures are closer to the mark. I could even be low. If borrowing continues at the recent pace of roughly $2.4 trillion a year, the debt will be closer to $45.6 trillion, and Trump’s share would approach 38%.
I am a Republican and I am a bit stunned. Despite the GOP claiming the mantle of fiscal restraint, under every president since 1981 Republican presidents account for about $19.8 trillion of the debt, roughly 49%. Democratic presidents since 1993 account for about $19.4 trillion, roughly 48%. The remaining just 2 to 3% predates 1981.
Thus, American voters can easily declare a plague on both their political houses for putting our children’s and grandchildren’s future at risk. While they may have different approaches to governing, both are exceedingly profligate and irresponsible. Each has borrowed with abandon, and my “party of limited government” has done so about as much as the party that never claimed to be limited. That is quite the irony. Republican presidents have run as fiscal disciplinarians and governed as spenders, from the Reagan-era deficits to the Bush-era wars and Medicare Part D, to the 2017 tax law and the deficits that accompanied the 2025 legislation. A party cannot claim the mantle of fiscal conservatism while supplying nearly half of the nation’s accumulated debt.
Out of fairness, two caveats need to be made. We did see one of the greatest health events in modern times – the COVID pandemic. The Committee for a Responsible Federal Budget estimates that policies enacted in President Trump’s first term added about $8.4 trillion to ten-year borrowing, about $6.5 trillion of it bipartisan (the CARES Act and related pandemic relief), against about $4.8 trillion if COVID relief is excluded. Biden’s enacted policies added roughly $4.3 trillion through mid-2024. Second, roughly a third of the debt added since 2017 is tied to pandemic borrowing under both men. Both facts argue against extreme caricature.
But my concern is the fact that the budget baseline and deficits really have not come down much since the pandemic. In fiscal 2022 we saw the budget deficit drop from $2.8 trillion to $1.4 trillion. Spending has outpaced revenue by roughly $2 trillion a year since fiscal 2023. Today we are back at $2 trillion in deficits. Baseline spending did not come back to 2019 levels, even with some reasonable inflation. And the One Big Beautiful Bill Act (OBBBA) tax cuts and extensions, including spending offsets, add $3.4 trillion to $5.6 trillion over 10 years (depending on how you count it, whether you include interest payments, whether temporary tax provisions do or do not sunset, whether you use a dynamic or static model, and whether or not spending cuts are rescinded over time).
The trillion-dollar interest bill.
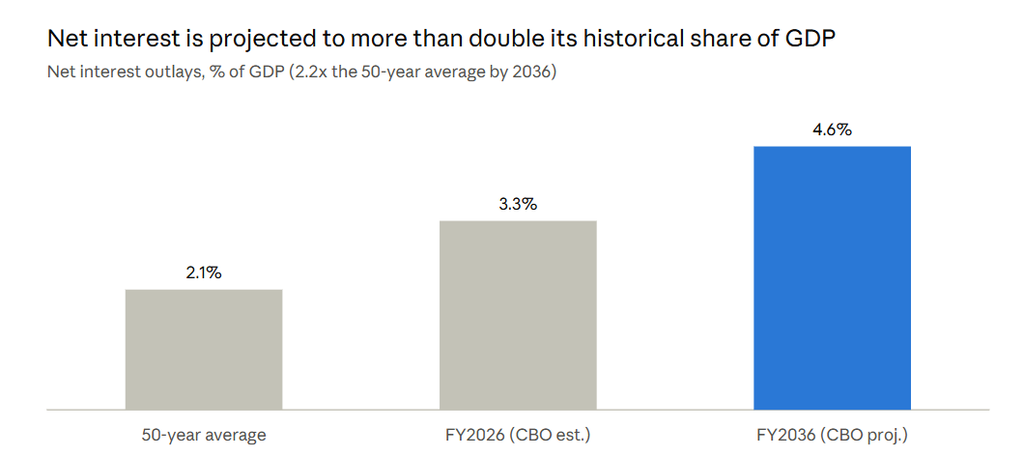
To me, the most alarming number in the federal budget this year is not the deficit, but our interest bill. Net interest outlays reached about $1.05 trillion in fiscal 2026 says the Department of the Treasury, while the CBO says it is near $1.1 trillion. These numbers are up 8% from $970 billion last year. Americans now spend more servicing past borrowing than on national defense, on Medicaid, and more than on any program other than Social Security and Medicare (the latter is expected to be about $1.1 trillion). Interest is the fastest-growing line in the budget, because the government must refinance old debt at today’s higher rates. The CBO projects net interest rising to 4.6% of GDP by 2036, nearly one-fifth of all federal spending. But we have those nasty bond yields I started with above. If they continue to surge, the financial picture on interest could become much, much worse. (If you are interested, I included four mini blogs after the conclusion on (1) the bond yield dynamics, (2) how it has become an international issue, (3) how we compare to other nations in terms of debt and (4) how AI investments are contributing to rising government bond yields. Kudos to The Economist for covering this important issue over the past many months.)
Discretionary spending gets squeezed.
The first thing a budget director learns serving at any level is that entitlements and interest on debt squeeze discretionary spending. This is true at the federal level. The three great entitlement programs dominate everything else. According to the CBO’s data, Social Security, Medicare and Medicaid together accounted for roughly $3.5 trillion of fiscal 2026 spending, and they drove the bulk of non-interest growth because of demographic and inflation trends. Social Security benefits rose $86 billion, or 5%, on higher average benefits and more beneficiaries. Medicare rose $77 billion, or 8%, on enrollment and higher payment rates. Medicaid rose $55 billion, or 8%, driven mainly by cost per enrollee rather than enrollment. In fiscal 2026, we spent about $7.4 trillion. So, $4.5 to $4.6 trillion, or 62%, were debt service and entitlements. Defense and related outlays were just short of $1 trillion ($965 billion). That brings us to over 75% of the budget which really cannot be touched, with many arguing we are spending too little on defense given changing technology and risks.
The pattern in the health programs matters to those of us who study healthcare for a living. Medicare and Medicaid are not growing at 8% just because of aging demographics. They are growing because prices, utilization, and administrative complexity keep climbing faster than the economy. Healthcare cost growth is the single largest controllable driver of the federal fiscal trajectory, and it is the topic this website exists to examine and promote reform.
No more than a 3% deficit spend is where we should be.
The European Union’s Maastricht reference value says a 3% deficit may be a reasonable target in good economic times. If we grow about 3 to 4% a year, a deficit near 3% roughly stabilizes the debt ratio. The United States’ own 50-year average deficit has been in the neighborhood of 3.8% of GDP, a figure that itself includes recessions, wars and the financial crisis.
Deficits above that level are defensible in a recession, a war or a financial emergency, when public borrowing replaces collapsing private demand. They are not defensible in an expansion with low unemployment. Today the U.S. deficit is over 6% of GDP, in a period in which a prudent state would run deficits below 3% or even surpluses. Note that France, the European poster child for fiscal trouble, is running a deficit below ours. Among peer countries, only the United States has a larger deficit than France.
The obligations beneath the debt.
The $40 trillion debt is only what we have already borrowed. It does not include the promises we have made and not funded. Some of these are not technically liabilities on the books since Congress can change benefit formulas. But they are legal commitments that voters expect to be honored, and as a practical matter they behave like debts. I will list the principal ones, with the necessary caution that these are present-value, 75-year estimates and overlap with the federal debt partially.
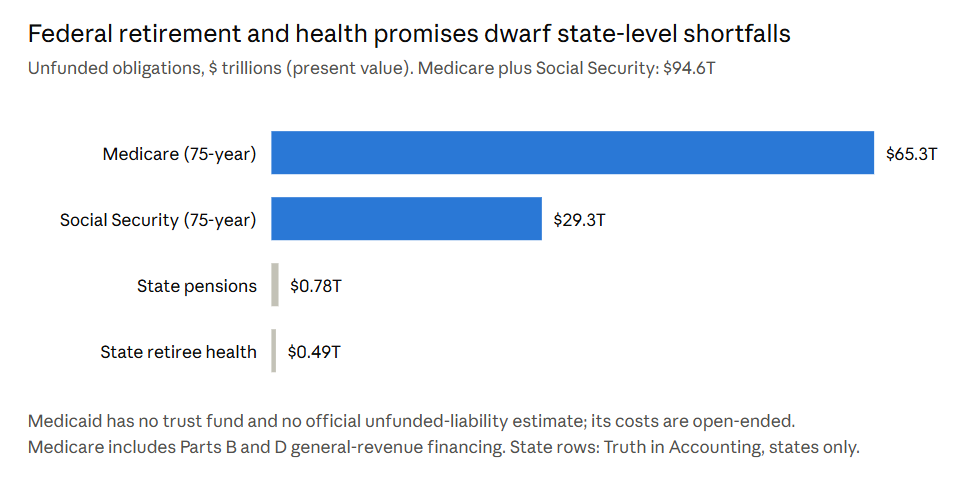
Social Security. The 2026 Trustees report puts the 75-year unfunded obligation of Social Security at $29.3 trillion, up from $25.1 trillion a year earlier and equal to 1.5% of GDP. The retirement trust fund is projected to be depleted in late 2032, at which point benefits would be cut by roughly 22% absent action.
Medicare. The Trustees estimate Medicare’s 75-year unfunded obligations at $65.3 trillion, up from $60.3 trillion a year earlier, about 3.5% of GDP. Of that, roughly $4 trillion is the Hospital Insurance shortfall; the remaining $60.9 trillion is the general revenue Parts B and D will require. The hospital trust fund is projected to be insolvent in 2033, which would trigger an 11% payment cut. The general revenue portion is not insolvency in a technical sense, because those parts are financed by appropriation. But it is a question of whether we will be able to afford those steady-state expenditures down the road.
Medicaid. Medicaid has no trust fund and therefore no formal unfunded liability. But it is a federal-state entitlement. It is an open-ended obligation that will grow with healthcare prices and an aging population.
State and local pensions. The picture here is better than a decade ago, thanks to strong markets and higher contributions. Unfunded state and local pension liabilities are $1.13 trillion in 2026, down from $1.37 trillion, with an 85 percent funded ratio, the best since 2009. That figure covers state and local plans combined. The state pension shortfalls are about $775 billion.
State retiree healthcare. There is $490 billion in unfunded state retiree healthcare. Retiree health benefits are usually funded pay-as-you-go, with little or no money set aside. As a former state budget director, I can attest that both the pension and retiree health commitments sneak up on a state.
The American privilege could erode.
America has been protected from the consequences of its fiscal habits by the dollar’s special status globally. Because the dollar is the world’s reserve and trading currency, foreigners and central banks hold Treasuries in great size, which lowers borrowing costs for the U.S. government, businesses, and homebuyers alike. Economists call it the exorbitant privilege. Over many decades, it has muted the usual penalty for overspending.
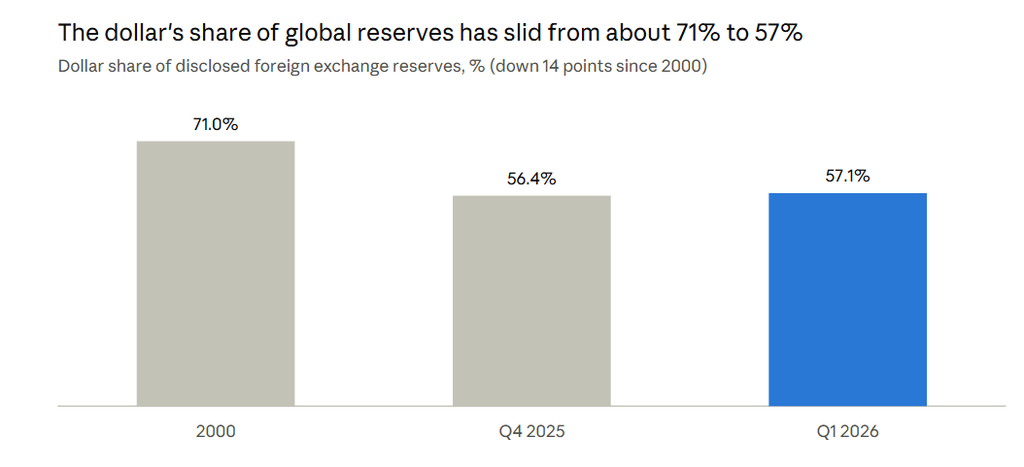
That privilege is no longer a certainty. According to the International Monetary Fund (IMF), the dollar’s share of disclosed global foreign exchange reserves fell to about 56.4% at the end of 2025, the lowest this century, down from roughly 71% around 2000. In the first quarter of 2026 it ticked up to 57.1%, but the IMF noted that about half of that gain was valuation from a stronger dollar rather than new buying. Gold, meanwhile, has overtaken Treasuries as the largest reserve asset, though largely because of price appreciation. An Official Monetary and Financial Institutions Forum survey of 90 central banks in June found that 56% of respondents intended to increase currency reserve diversification. The erosion is gradual rather than sudden, and I do not predict a collapse of the dollar. But it is worrisome. When foreign buyers become more price-sensitive, as the recent auctions suggest, a higher yield is the price of their participation. How far could this go and how quickly if we continue our unfettered ways?
The coming reckoning.
We are running deficits over 6% of GDP in good times. Interest is a trillion dollars a year and rising. The major entitlement trust funds approach insolvency in 2032 and 2033. Yields are at levels not seen since before the financial crisis. The global appetite for dollars is slowly eroding and diversifying. Meanwhile corporate borrowers are competing for capital.
Every dollar the government borrows to pay interest is a dollar not invested in plants, equipment, research or housing. Higher government yields raise borrowing costs for every mortgage, auto loan, and business. Over time, the economy’s capacity to grow shrinks. Yes, it has many assets, such as unrivaled capital markets and a centuries-old knack for innovation. But it is not a stretch to suggest the U.S. could become like the old anemic economies of Europe over time, which are heavily indebted and slow-growing and which struggle to expand even in good years. The Penn Wharton Budget Model has warned that beyond a debt-to-GDP ratio of roughly 210% no feasible tax can finance the interest at market-demanded returns. We are at about 100% held by the public and 124% counting all gross debt and rising. The point of no return is far off, but the painful consequences are not.
What would a serious program look like? It would start by acknowledging that revenue and spending both need attention, but that the dominant driver is healthcare and retirement spending growing faster than the economy. It would set a deficit target, balance the budget in normal times, and have a deficit of no more than 3% in a downturn. This extraordinary discipline is needed due to the tragic state of our finances. It would reform Social Security’s solvency soon enough to give workers time to adjust. And it would tackle healthcare costs with real reform: price transparency and competition, payment systems that reward prevention and outcomes over volume, coverage that does not leave gaps that push costs onto emergency care, and an end to the administrative waste that consumes a large share of every health dollar. These are the themes of my book, because healthcare cost control and fiscal sustainability are the same fight.
As the midterms approach, voters should ask every candidate, of every party, three questions. What deficit will you accept in a good economy? What specifically will you cut or raise to get there? And how will you bend the healthcare cost curve? Anyone who answers with the typical promise of growth, eliminating waste, fraud and abuse, or the other party’s sins is not answering honestly. The bond market has stopped accepting those answers. The voters should as well.
#midterms #government #deficits #healthcare
—
Mini blogs with details on the subject matter above.
On the bond yield crisis.
A government bond is an IOU. The Treasury sells a security promising fixed interest payments, called the coupon, and the return of principal at maturity. Investors buy at auction, then trade the bond in the secondary market, where its price moves over time.
The key relationship is that price and yield move in opposite directions. Suppose you buy a ten-year note paying 3%. If new notes now pay 5%, nobody will pay full price for your 3% note. Its price must fall until its effective yield, the return a buyer would earn at the new price, matches the market. Higher yields mean lower prices, and vice versa. That is why a bond sell-off and a yield spike are the same event.
Three forces set yields. First, the policy rate the central bank controls at the short end. Second, expected inflation, because investors demand compensation for the erosion of fixed payments. Third, the term premium, the extra return required to lock money up for 10 or 30 years and bear the risk that inflation, supply, or fiscal trouble will impact the investment. When investors worry that a government will keep borrowing without restraint, they demand a larger term premium. The government then pays more on every new bond and every rolled-over one. There is a selling point at which buyers go on strike unless offered a higher rate, and at that point the government’s borrowing cost becomes a verdict on its fiscal credibility.
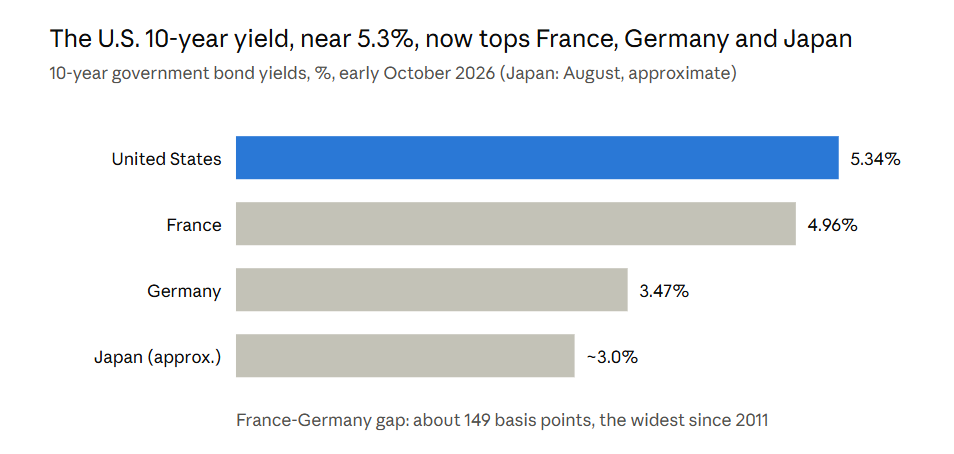
That is where we are. On October 1, the U.S. 10-year Treasury yield touched 5.34% and the 30-year reached 5.68%, the highest levels in about 24 years. The 10-year closed above 5% in September for the first time since 2007, and the 30-year had already reached its highest level since 2007 in August after auctions that cleared at 19-year and 25-year highs. The Treasury has responded by expanding its long-end buybacks, an acknowledgment of the strain, though analysts note it can slow the rise but not reverse the supply behind it.
It is an international issue.
This is not an American problem alone. It is a developed-world problem in which America is the largest and most important case.
France is the most acute illustration. French public debt reached about €3.6 trillion, or 119% of GDP, by mid-2026, and the 2026 deficit is about 5.4% of GDP, the third straight year above 5%. France has not run a budget surplus since 1974. On October 1, the Lecornu government presented a 2027 budget aiming to cut the deficit to 5%, with a record €340 billion of borrowing planned for next year, while the fiscal watchdog called its growth assumptions optimistic. The market’s response: the French 10-year yield touched 4.96%, its highest since 2002, and the spread over German Bunds reached roughly 152 basis points, the widest since the 2011 euro crisis. French yields at one point exceeded Italy’s, a reversal few would have predicted a decade ago. The third quarter was reportedly the worst for French sovereign debt since 1987. Debt service is projected to climb from about €79 billion in 2026 to €91 billion in 2027, and the government’s minority status makes the budget’s passage uncertain.
The United Kingdom’s 30-year gilt yield recently rose above 6%, its highest since 1998. Germany’s 10-year Bund yield, around 3.5%, is its highest since 2011, and that is for the euro zone’s strongest borrower. Japan, whose government debt exceeds twice its GDP, has seen its 10-year yield rise from near zero in 2021 to almost 3%, with its 30-year above 4% and yields at the highest since the mid-1990s as inflation ends decades of deflation and the Bank of Japan retreats from bond purchases. The common thread to all of this is large debt, large deficits, inflation, and diminished central bank support.
Where the U.S. stands on debt.
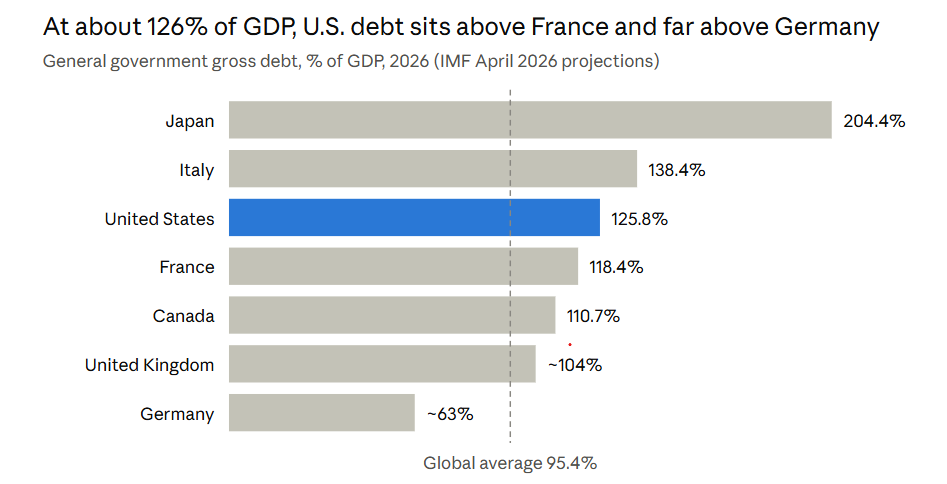
How does America compare? The IMF’s general-government measure, which adds state and local debt and is the standard yardstick across countries, puts the United States at about 126% of GDP in 2026. That is well below Japan (204%) and Italy (138%), but above France (118%), Canada (111%) and the United Kingdom (about 104%), and roughly double Germany’s (63%). The global average is about 95%.
Is there an AI crowd-out effect?
Governments are not the only borrowers in the market. The artificial intelligence buildout has made corporations into major competitors for the same pool of investable savings. Estimates of 2026 capital spending by the largest AI hyperscalers range from roughly $750 billion to $940 billion, with more than $1 trillion expected in 2027. That spending has outrun free cash flow, so the companies are issuing bonds at record scale. By one Wall Street Journal count, about half of new investment-grade issuance this year has been AI-linked, and analysts at JPMorgan and Lloyds have argued that this supply is lifting long-dated yields, with one investor putting the point bluntly: why lend to the government at under 5% when a blue-chip tech company offers more?
In fairness, the evidence is debatable. Broad investment-grade spreads ended in August where they began the year and that demand has so far absorbed the supply. AI investment is simply an additional source of pressure at the margin. In the end, the main cause for yield changes is that government demand for capital has been growing for decades without regard to supply. Business investment may be tipping the scales, but the scale was already overloaded by Washington’s profligacy. Thus the AI investment demand compounds the main issue. A government that borrows $2 trillion a year in good times has little room to maneuver when private investment competes for the same dollars.
— Marc S. Ryan