
June enrollment growth slows, but SNPs surge
In a February 16 blog, I detailed the growth in Medicare Advantage (MA) from February 2025 to February 2026 after a delay from the Centers for Medicare and Medicaid Services (CMS) in posting the annual data. As I noted, the January enrollment statistics in both years seemed off so many analysts are comparing February to February each year. Each month since then I have updated with monthly growth numbers. Now, we have June results. For those who may have missed earlier blogs, I am refreshing on some of the annual results.
The annual statistics show some of the financial struggles the industry continues to have. Growth is way down compared with prior years in the 2020s due to major geographic contractions as well as plan benefit reductions by major MA players the past few years.
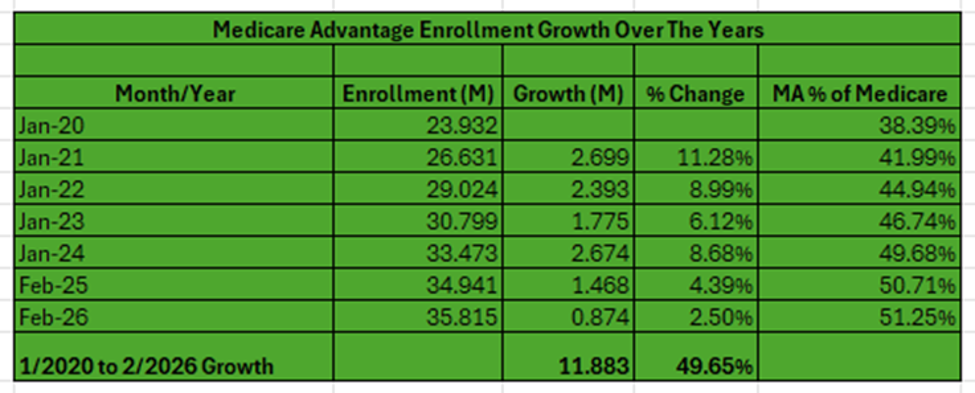
As the chart below shows, February 2025 to February 2026 enrollment growth was just 874K or 2.5% — way down from annual growth from January 2020. MA enrollment continues to grow due to aging in America each month as well as the secondary enrollment process from January through March of each year.
What do the latest statistics show?
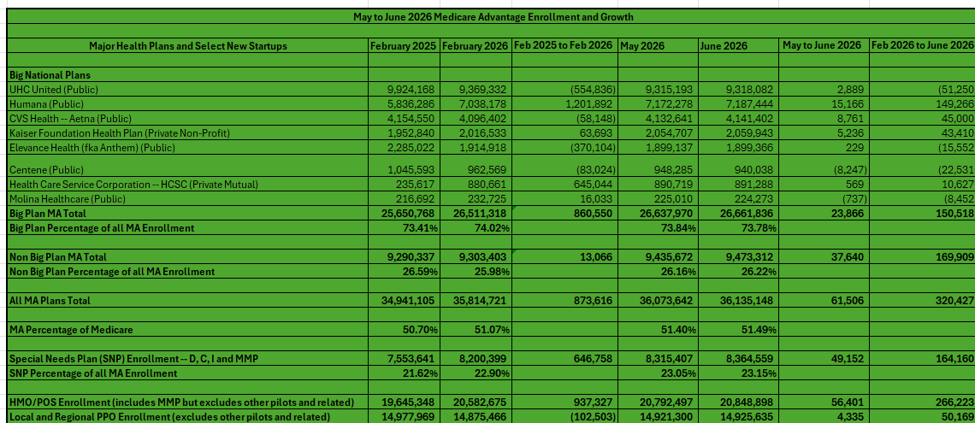
Enrollment in MA reached 35.815M in February 2026. From February to June, enrollment climbed by about another 320K. From May to June, enrollment grew about 62K. In June enrollment was about 36.135M.
How did Big MA do?
From February 2025 to February 2026, Big Plan MA enrollment grew by about 861K or 3.4%. Big MA enrollment hit 26.511M in February 2026. Big MA’s penetration was 74.02% in February 2026. Big MA plans grew about 151K from February to June 2026. Big MA plans now have about 26.662M enrollees.
However, hidden in these numbers is a very poor open enrollment season. From December 2025 to February 2026, Big MA contracted by about 328K. That contrasts with non-Big MA, which grew by about 443K in open enrollment. Non-Big MA grew by about 170K from February to June. Non-Big MA plans now have about 9.473M. Non-Big MA plans have taken 53% of all enrollment growth since February and 61% of new enrollees in June.
United Healthcare has contracted by about 51K between February and June 2026, with a growth of 3K in June. Humana has grown by about 149K from February to June 2026, with growth of about 15K in June.
CVS grew by about 45K from February to June 2026, with a growth of about 9K in June. Kaiser grew by about 43K from February to June 2026, with growth of about 5K in June. Elevance Health has shed about 16K since February. Centene has lost about 23K since February, with a loss of about 8K in June. Health Care Service Corporation (HCSC) has grown about 11K since February, with Molina contracting about 8K.
Special Needs Plans continue to explode.
Special Needs Plans (SNPs) continued to see a healthy increase in enrollment. From February 2025 to February 2026, SNPs grew to about 8.200 million, a gain of about 647K or 8.56%. SNPs grew about 259K in open enrollment. SNP enrollment now stands in June at 8.365M. SNPs have grown by 164K since February, with 49K of that in June. SNPs took 80% of all enrollment growth in June and 51% since February. SNPs are now over 23% of all MA enrollment.
PPOs vs. HMOs
Over the years, PPOs began growing and competing well with HMOs in terms of raw numbers as well as percentage growth. While PPOs’ sheer number and percentage growth were beating HMOs over the past several years, that trend changed beginning in 2025. From January 2023 to January 2024, HMOs grew about 853K (4.8%) and PPOs 1.861 million (14.8%). From January 2024 to February 2025, HMOs grew more than PPOs in terms of numbers and percentage: HMOs up about 882K (4.7%) vs. PPOs up about 580K (4%). From February 2025 to February 2026, HMOs were up about 937K (4.8%), while PPOs were down by about 103K (-0.7%).
From February to June, PPOs grew by about 50K, with about 4K growth in June. From February to June, HMOs grew by about 266K, with about 56K new enrollees in June. HMOs took 92% of growth in June and 83% since February. The meager growth in PPOs can be traced to the major contraction of PPO products as MA plans financially realign.
#medicareadvantage #enrollment
— Marc S. Ryan