
While cut points and averages surged, a lot goes into whether overall ratings will go up as well.
Plan Preview 2 is here and today I am covering two topics.
1 – What will the Centers for Medicare and Medicaid Services (CMS) do on the Stars Ratings front?
2 – What do the cut points, average values, and average ratings tell us about whether overall ratings will go up?
What will CMS do on Star Ratings?
As we know, when the Clover lawsuit decision occurred, CMS quickly moved to recalculate a Clover contract using the court Clover Specific remedy. A short time later, CMS recalculated all other contracts using a “better of” Original Ratings and a CMS Recalculation methodology that simultaneously conformed with the court decision and ignored it. Three new lawsuits emerged, which are pending now. First, Elevance Health is arguing that it deserves a recalculation based on the Clover Specific methodology. Scan and Alignment are arguing a Clover Strict scenario, where more measures are excluded from the CMS Recalculation methodology.
Many Stars analysts, including me, have argued that there was a strong likelihood that CMS would award SY 2027 again based on the same or similar better of strategy. So far, that has not panned out. We thought we would know the strategy by Plan Preview 2. But the announcement this week did not deviate from the standard announcement. The agency HPMS notice simply declared that Plan Preview 2 was commencing. The published final Tech Notes for SY 2027 mentioned nothing other than the Original Ratings calculations.
So what gives? It appears right now that CMS has decided to simply maintain the use of the Original Ratings scenario despite some measures being struck down due to statutory and regulatory deficiencies. Of course, CMS could stun us with a new memo, but the current strategy could be rooted in a few things:
- CMS has now appealed the Clover decision and does not want to cloud any of its arguments.
- Relatedly, CMS may be banking on the fact that any new lawsuits slow or are stalled temporarily due to the agency’s appeal. This may give CMS time to remedy any issues.
- Its effort to satisfy plans through the “better of” strategy did not work as it led to multiple lawsuits. CMS officials were damned if they do and damned if they don’t.
- The pressure is a bit off with the denial of the preliminary injunction in the Elevance case.
While I predicted a “better of” approach for SY 2027, I can see CMS’ viewpoint here. Going the way of “better of” likely would not have satisfied every plan. And the SY 2026 approach spawned additional plan arguments to make in court. Still, in light of the Clover decision, plans will go back to court on SY 2027 if they see a scenario that benefits them.
Plan Preview 2 Data: What does it tell us on coming Star Ratings?
Plan Preview 2 has begun and we have out first glance at data for Medicare Advantage (MA) Star Year (SY) 2027. Until the final announcement in October, we don’t know exactly what the Stars landscape will look like, but here is what we know and don’t know so far.
Volatility in cut points, average values, and average ratings
There was tremendous volatility in cut points. You will see various assessments by analysts as to what went up, what went down, and what stayed the same. It all depends on what measures you count. For what it is worth, I looked at all returning measures to see what changes occurred. Here is my take, which generally maps to what others are saying:
- About 54% of cut points went up.
- About 36% stayed the same.
- About 10% went down.
Average measure values also had major changes:
- About 36% of average values went up.
- About 49% stayed the same.
- About 15% went down.
Average ratings also changed significantly:
- About 44% of average values went up.
- About 31% stayed the same.
- About 26% went down.
Comparison to SY 2026 results and what might this tell us for October overall ratings results?
As you can see from the chart below, there has been volatility in both years cut points, values, and ratings. In SY 2026, higher cut points were about the same, with more of the same in SY 2027 and fewer falling in SY 2027 as well. Average values tended to have increased more in SY 2026. Average ratings increases were about the same in the two years but more stayed the same in SY 2027.
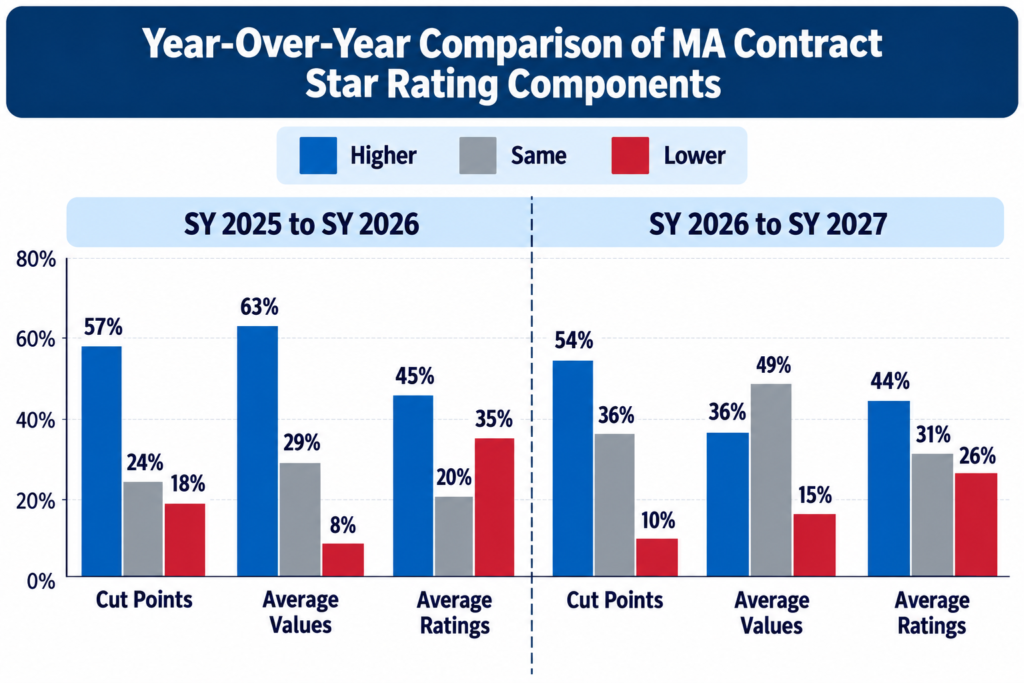
But a lot goes into interpreting these changes and what it may mean in SY 2027 for overall ratings. We saw more improvement than not across the three categories in SY 2026, yet Stars overall barely recovered. Because all of this is graded on a curve (so to speak) via clustering (with some guardrail factors), higher cut points, values and ratings do not necessarily mean higher overall ratings. There could be a few things at work.
MA retrenchment impacts cut points and averages
We are entering into a new era that requires study to evaluate cut points and performance. Beginning in 2024, we began to see so-called MA Retrenchment, where plans began to shed lives, products and geographies. This occurred in 2024, 2025 and 2026 and this likely will continue into 2027. Retrenchment was light in 2024, just 1% of enrollees were impacted by closure of their plan. But 2025 was when it began to hit, which is the measure year we are talking about. In 2025, about 6.9% of enrollees were impacted due to closures of plans and products. That surged to 10% in 2026. At least 1M will be impacted so far for 2027, compared with 2.6M to 2.9M in 2026.
What does this mean? While it is not universally true, generally speaking plans closed down benefit packages and products that were poor performing, which generally would include those with lower Star ratings. So, a good deal of the better cut points and higher averages may be a result of lower performing plans exiting and forcing up all these factors. Because Stars is graded on a curve, that may not translate into overall higher ratings.
Investments by plans may be paying off
There is reason to believe that some performance in certain areas is getting better. While the retrenchment impacted some HEDIS measure cut points, we did see about two-thirds to 70% of cut points increase there and some were cut off at the 5 maximum increase. At least some of this is related to deeper penetration in risk or other value-based-care (VBC) arrangements between payers and providers. These deals concentrate on HEDIS measures. Further, we do see some evidence that plans are making investments in supplemental and electronic data as well as interoperability in anticipation of ECDS electronic measure conversion. Year-round AI-supported chart abstraction is also taking on steam.
On Part D Drug measures, we saw some rises too, but they were not demonstrable.
Despite keen interest in investing to move CAHPS and HOS surveys, very little change was reported, including on the 3x weighted improving and maintaining HOS measures.
Changes in Operational measures were largely at the low end of cut points, signaling that retrenchment likely moved those. The Special Needs Plan Care Management measure increased across the board, signaling investments here in a growing product.
On Improvement clustering points, it became easier to hit 2, 4, and 5 (3 is always set to 0). This generally would indicate that remaining plans have struggled a bit to improve. And the average ratings for both 5x improvement measures went down — 3.5 to 3.3 for Part C and 3.4 to 3.1 for Part D.
On Reward Factor, the summary mean thresholds dropped and the variance thresholds increased, making it easier to qualify for the reward factor– if you can get there. But that also is a sign of possible poorer and more inconsistent performance. It also points to struggles for those in the 3 to 3.5 range that are working to get to the quality bonus category.
So, should we expect a major uptick in October on overall ratings and the percentage in 4 Star plans? Judging from SY 2026 statistics and results, I would not count on it. The cut point and averages increases look to be due to retrenchment and perhaps some industrywide upticks in certain clinical measures areas. The improvement and reward factor data point to poorer performance. Overall, the picture looks much like SY 2026, if not worse. If there is some sort of uptick due to the concentration in certain plans, it certainly will not be terribly dramatic. In fact, if a large player is hurt as may be the case, we will see a decline in overall performance.
Some measure details
Colorectal Cancer Screening (COL) – I called this out last year but will do so again. I do not quite understand the rationale of having COL be deemed a non-substantive change when it went to ECDS in MY 2024 but be characterized as a substantive change with the additions of 45 to 50 year olds. It was “guardrailed” last year, but not this year, which explains in part the cut point changes of 4 to 11. However, some of this could be plans catching up to the ECDS conversion. This year COL is not in improvement.
Controlling Blood Pressure (CBP) – Cut points changed by 4 or 5 points across the board, likely tied to some of the investments I talked about above as well as new views on plans related to chart chases, oversampling, and more.
Kidney Health Evaluation (KED) – This measure had 9 to 12 cut point moves. As it is just in year two, there are no guardrails. The across-the-board major increases in cut points may in part tie to investments made on a new measure (although exits likely impacted some).
Follow-Up ED Visit (FMC) – This measure went up by 5 points at each cut point. The measures is guardrailed. I bet that investments are being made here given the surge of dual eligibles with more chronic conditions entering the program.
Care for Older Adults (COA) – The COA measures appear to be having investments as well due to the influx of duals and growth in Special Needs Plans (SNPs).
Transitions of Care (TRC) and Plan All-Cause Readmissions (PCR) – Poorer performing plans are struggling with TRC and all plans seem to be struggling with the readmissions.
#medicareadvantage #cms #stars #quality #planpreview
— Marc S. Ryan