While enrollment growth slowed, results show the staying power of Medicare Advantage
After a long delay, the Centers for Medicare and Medicaid Services (CMS) finally published results for January and February for Medicare Advantage (MA). While many predicted that the program would contract, I had said that enrollment would be flat or one of the lowest growths we had seen recently. Some analysts suggested that there would be a decline because of the mass exodus of large plans from certain markets and efforts by them to shed huge amounts of enrollment. The idea was that other plans could not pick up the slack and exits in certain counties would have left few opportunities for plans to find alternatives in MA.
But despite the huge challenges in the program, MA showed some resiliency. Yes, enrollment growth was way down, but it did not contract as some had predicted. It very much shows that, despite some major benefit losses due to the financial woes of the industry, the half-trillion plus private alternative to Medicare is alive and well because of the huge value proposition it has compared with the archaic transactional system. It appears that seniors and the disabled continued to see the value and sought out the best plan they could get despite the benefit reductions, including with their existing insurer or smaller and regional players in place of big national plans.
Why is Medicare Advantage (MA) attractive?
As I say often in my blogs and podcasts, MA has huge advantages over traditional fee-for service (FFS) and thus has major appeal to Medicare beneficiaries. Despite some criticism, often generated by political critics and providers, members are highly satisfied with MA and the supplemental benefits and out-of-pocket protections it provides.
Despite some lower rate increases of late, MA plans are still able to offer better benefits and make products appealing for a few reasons:
- MA rate-setting largely is based on the antiquated and inefficient FFS program’s costs. This allows plans to deliver base services far more efficiently and pass savings on to members in additional benefits above and beyond FFS. These savings are mandated to be passed through to member benefits. Plans do a variety of things with the money:
- Reduce traditional program cost-sharing.
- Fill in huge FFS program benefit gaps (such as high costs of the inpatient benefit and the cap on covered days) that often bankrupt seniors and the disabled.
- Add numerous supplemental benefits not found in FFS.
- The Star quality bonus program rewards high-performing plans with additional revenue to augment benefits even more.
- MA plans are improving outcomes (where FFS is failing miserably) and providing critical services, such as case and disease management.
The combination of the benefits and quality focus again makes for a great value proposition. MA has become one of the greatest social safety nets for lower- and lower middle-income seniors. It can mean hundreds and sometimes thousands of dollars a year in additional support to fixed-income Americans. The value proposition means members flock to MA. And savvy Medicare beneficiaries are also moving to the highest-performing plans from lesser rated ones to get added benefits and more quality.
Analysis approach and parameters
What did I do? I analyzed the February 2025, December 2025, and February 2026 enrollment spreadsheets posted by the Centers for Medicare and Medicaid Services (CMS). Again, many analysts and I feel there was something wrong with the January 2025 spreadsheet and I set that aside. Similarly, the January 2026 spreadsheet appears a bit off as well. But even if it is accurate, it is best to compare February 2025 to February 2026 to ascertain a reasonable growth result over the most recent year.
While the big enrollment season ended on December 7, 2025, enrollment will continue to increase in the next several months. Some may have signed up too late for January 1 enrollment. There also is an additional enrollment period for some enrollees that occurs from January 1 to March 31. Given ongoing marketing by plans, this tends to increase MA numbers in the first quarter.
To derive enrollment trends in MA, I focused my analysis on overall MA membership growth as well as big national plans and select prominent startups (often known as “insurtechs”).
The plans reviewed were:
Big National Plans:
- United Healthcare
- Humana
- CVS Health’s Aetna
- Elevance Health
- Kaiser Health Plans
- Centene
- Health Care Services Corporation (HCSC)
- Molina Healthcare
Prominent Startup Plans:
- Alignment Healthcare
- Clover Health
- Devoted Health
I did not look at standalone Part D plans, but at the following types of MA plans (broadly speaking):
- Local Health Maintenance Organizations Plans (HMOs)
- Local HMO Point of Service Plans (POS)
- Local Preferred Provider Organization Plans (PPOs)
- Regional PPO Plans
- Medicare-Medicaid Plan HMOs (terminated as of 2026)
- Private Fee for Service Plans (PFFS)
- 1833 and 1876 Cost Plans
- Medicare Medical Savings Account Plans (MSAs)
- Program of All Inclusive Care for the Elderly Programs (PACE)
Medicare Advantage enrollment growth since 2020
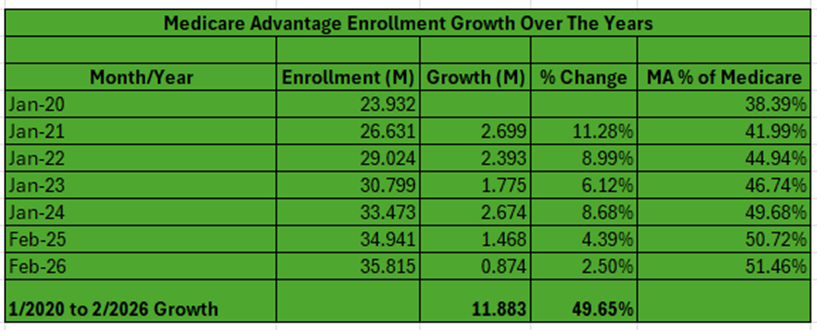
Let’s cover growth over time in MA. I like to track how the MA program is doing over time so I have kept comprehensive statistics for years. Let’s take a look at growth since 2020. See the first table in this blog for a simplified view.
From 2020 to 2026, MA has grown almost 50% or 11.9M lives. As of February 2026, 35.815M members are enrolled in MA. Very few public and private estimates predicted this. We stand at about 51.5% of Medicare beneficiaries enrolled in MA. Enrollment penetration grew by 34% in the timeframe.
Enrollment growth was stunning from 2020 to 2024. We saw a tailing off of growth in 2025 and even more so in 2026 – just 4.4% and 2.5%, respectively. These statistics show some of the financial struggles the industry continues to have. The smaller growth numbers are a symptom of the geographic, product, and benefit contraction, especially by major national plans. Overall, though, the 2020s have been a defining period for MA.
2025 to 2026 enrollment growth
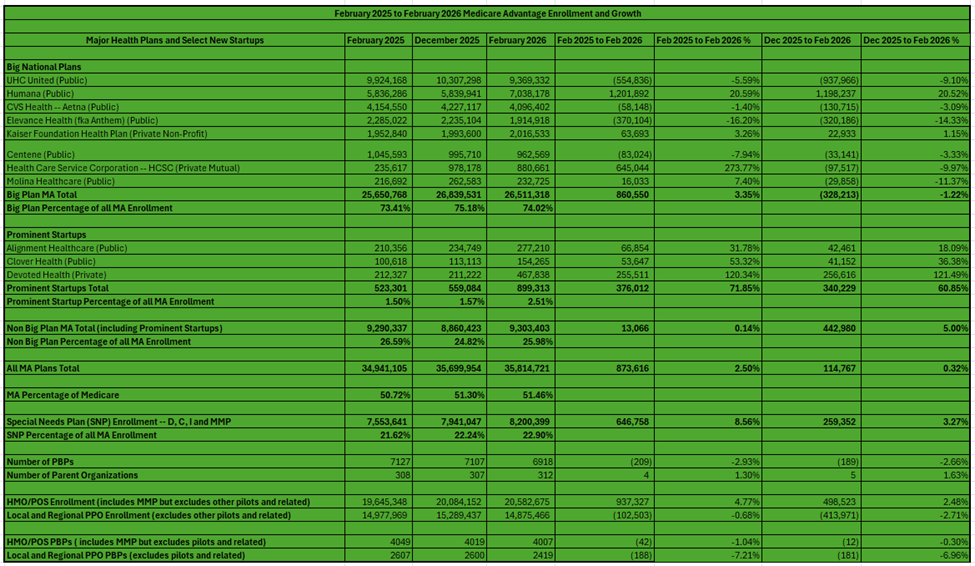
The second table in this blog provides details on 2025 to 2026 enrollment growth. Here is an overview of the findings:
- MA membership grew from 34.941 million in February 2025 to 35.700 in December 2025 to 35.815 million in February 2026, a one-year increase of about 874K or 2.5%. The open enrollment growth from December 2025 to February 2026 was about 115K. The open enrollment slump was not close to the 1M some had said it might be.
- National MA plan enrollment rose from 25.651 million in February 2025 to 26.511M – 861K or 3.35%. Showing efforts by some plans to reduce membership during open enrollment, Big Plan MA enrollment dropped from December 2025 to February 2026 by 328K or -1.22%.
- Big Plan MA enrollment represented about 73.41% in February 2025, 75.18% in December 2025, and 74.02% in February 2026. Interestingly, 98.5% of growth year over year was in Big MA plans. But from December 2025 to February 2026, non-Big MA plans took in 443K, while again Big MA contracted by 328K. Non-Big MA plans were otherwise basically flat from February 2025 to February 2026. Big MA plans still dominate the program, but the substantial decline in their share during open enrollment could signal a shift in the program overall. It also shows that the smaller and regional plans were ready to take on more enrollment.
The Big MA players
- UnitedHealthcare announced major financial woes during 2025 and this has sought to contract in 2026. Its enrollment is down 555K or 5.6% February to February and 938K or 21% from December to February. It has signaled that it plans to shed even more lives in 2026.
- Humana is a financial basket case too, but began its financial remake earlier than United. As such, it is far more bullish on enrollment for 2026. Because of its restructuring, its enrollment was basically flat between February 2025 and December 2025. But from December to February, it added almost 1.2M in the 2026 open enrollment. Some suggest that Humana may have added too many lives by not realigning its benefits, products, and geographies enough. This has led to investor worries that Humana may see margin erosion against its financial plan in 2026.
- CVS Health’s Aetna is in the middle of is financial recovery and its 2026 approach is sort of in the middle of United’s and Humana’s. It contracted by about 131K from December to February and is down 58K for the year. This comes after huge growth in 2024.
- Elevance Health is financially beleaguered too and shed members throughout 2025 and for 2026 open enrollment. It gained about 265K lives from January 2024 to February 2025, 13.1%. It was down 320K during the 2026 open enrollment and 370 from February 2025 to February 2026.
- Kaiser gained about 23K during the 2026 enrollment and 64K from February 2025 to February 2026.
- Because of its financial problems, Centene contracted 83K from February 2025 to February 2026, with 33K coming in the open enrollment for 2026.
- Cigna sold its almost 700K MA lives to mutual Big Blue Health Care Service Corporation in 2025. Thus, HCSC grew from 236K in February 2025 to 978K in December 2025. However, HCSC likely did not anticipate the challenging rate issues in MA. It shed about 98K or 10% of its lives in open enrollment.
- Molina grew about 46K from February to December 2025, in large part due to acquisitions. But it shed about 30K lives during open enrollment due to its financial issues.
- The prominent startups had absolutely stellar results from February 2025 to February 2026 and during the 2026 open enrollment. Collectively Alignment, Clover, and Devoted grew 376K for the year, with 340K coming during open enrollment. Devoted was flat during 2025, but grew 121% during open enrollment, adding 257K. Clover and Alignment grew 67K and 54K, respectively, year over year.
How did SNPs do?
Special Needs Plans (SNPs) have seen a meteoric rise in terms of investment, popularity, and enrollment over the past few years. continued to see a healthy increase in enrollment. From February 2025 to February 2026, SNPs grew an additional 647K, with 259K coming from December 2025 to February 2026. SNP growth was 74% of all enrollment growth in MA from February 2025 to February 2026. SNPs grew 259K from December to February, while non-SNP plans contracted by 144K — for a net of 115K overall in the timeframe.
Some quick facts on SNPs:
- SNPs usually are HMOs, but there are some L-PPOs and R-PPOs.
- The vast majority of enrollees are in dual eligible SNPs (D-SNPs) – 6.425M or 78.4% as of February 2026. D-SNPs grew from 6.324M in February 2025, or 101K (16%).
- Chronic Care SNPs had healthy growth in 2025 and now in 2026. C-SNPs now have 1.646M or 20%. C-SNPs grew from 1.108, or 538K (49%). CMS has indicated it wants to rein in the growth of C-SNPs, worried that more and more dual eligibles are enrolling in them without the regulatory and clinical safeguards that exist with D-SNPs.
- Institutional SNP enrollment is about 129K or 1.6% as of February 2026, up from about 122K in February 2025.
Benefit packages
Given some concern about financial performance and growing risk, the number of Plan Benefit Packages (PBPs or what you would think of as a benefit plan) dropped from 7,127 to 6,918, about 209 or roughly 3%. The number of sponsors or parent organizations is up 4 to 312.
HMOs vs. PPOs
- Let’s look at the products that grew the most. I often talk about the surge of PPOs for a number of reasons – the move of MA into more rural and suburban areas as well as more middle-income and wealthier people joining MA. Over the years, PPOs began growing and competing well with HMOs in terms of raw numbers as well as percentage growth. While PPOs’ sheer number and percentage growth were beating HMOs over the past several years, that trend changed from January 2024 to February 2025 and again from February 2025 to February 2026. PPO products were shed during plan retrenchment.
What happened from February 2025 to February 2026?
- PPO PBPs dropped from 2607 to 2419, or 188 and 7.2%, year over year. HMO products dropped just 42(1%) in that time.
- HMO enrollment grew 937K while PPO membership dropped 103K.
MA contraction’s impact
A number of studies show the magnitude of the fallout on enrollees of the MA contraction in 2026. Several studies say between 2.6 and 2.9 million had to find new plan products due to MA plans leaving counties, contracting products, or eliminating certain plans. A study in JAMA found that one in 10 MA enrollees were forced to disenroll from their current product choice heading into 2026 due to insurer exits or contractions. That is a ten-fold increase from historic averages and is up from a very high 6.9% in 2025.
Smaller insurers accounted for 48.8% of forced disenrollments. Twelve states had more than 20% of their MA enrollees facing forced disenrollment. Rural and low-MA penetration areas were hardest hit. Medicare beneficiaries in those areas were nearly twice as likely to face the loss of their current plan choice. PPO eliminations were also very high.
Conclusion
In sum, aging, reasonable reimbursement (over the long haul not right now), Star bonuses, risk adjustment (at least for now), and an old and tired traditional FFS system as a competitor makes MA a good and usually growing place to be for insurers. Plans continue to make investments, especially in the area of SNPs.
But there is no doubt that the current financial stresses caused a major contraction of benefits and footprints, causing lower growth in both 2025 and 2026 as well as having huge impacts on enrollees. This was evident throughout the industry but especially among many big players. With the exception of Humana, most big plans shed lives during the 2026 open enrollment.
While financial problems hit all size plans, the non-Big MA players overall seem to be doing better and were able to capitalize on this with better enrollment numbers during open enrollment 2026. SNPs continue to thrive and HMOs are back at center stage given the much higher costs of PPOs.
#medicareadvantage #enrollment #medicare #coverage #stars #healthplans
— Marc S. Ryan