Huge shock to MA plans with near zero rate hike in Advance Notice
The Trump administration issued the 2027 Advance Notice for Medicare Advantage (MA) and Part D rates and other policy changes this week. I have reviewed the 169-page Advance Notice, the Centers for Medicare and Medicaid Services (CMS) Fact Sheet, and CMS Press Release. Below are the key highlights. The advance notice will be finalized by early April.
I will publish updates on the Stars roadmap front from the Advance Notice on Monday in conjunction with Lilac Software. This will detail all the proposed Star measure changes, updates, and information discussed in the Advance Notice.
MA rate proposal
The Trump administration threw Medicare Advantage (MA) for a loop when it issued the 2027 Advance Notice recently. MA plans just weathered a three-year phase-in (2024 to 2026) of the new v28 model. By my calculation, that took 7.62% out of rates with normalization. With skyrocketing utilization, plans had hoped for a 2027 hike that exceeded the rough 5% hike in 2026.
But Trump’s CMS has now proposed two new risk adjustment reforms that take the almost 5% growth inflationary hike down dramatically – almost to 0. That sent most major stocks down, with United Healthcare and Humana getting walloped the most given their size and how they practice risk adjustment.
Details
Let’s get into the economics of the rate hike and the risk adjustment change.
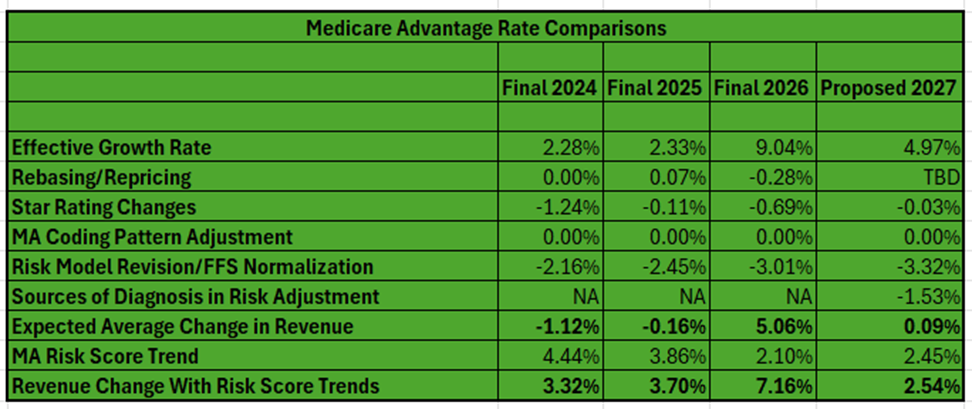
As you can see in the table below, the proposed rate hike for MA in 2027 is a 0.09% overall industry increase. That is an increase of roughly $700 million in MA payments for 2027 compared with $25 billion in 2026!
When considering estimated risk score trends in MA and population changes, the expected average change in payments will be 2.54%. But plans reject this characterization as the real trend because they say risk score trends recognize risk changes in the program from year to year. Opponents say much of the risk score trends are a symptom of ongoing risk adjustment gaming and overpayments. I generally side with the MA plans on this one as a good part of the trends do represent population and risk changes. Indeed, poor or negative margins of late seem to back up the claim. As well, annual risk score trends are down demonstrably from the past.
Let’s break down the component parts of rate-setting that derive the 0.09% (or 2.45%):
- The effective growth rate (EGR) is derived from the growth in the per capita costs in the traditional fee-for-service (FFS) program and MA for the non-end-state-renal disease (ESRD) populations. It is a national estimate. Trends can be different in each county and region. Remember that the eventual county benchmarks are adjusted from there based on several parameters, including whether a county is at 95% up to 115% of FFS costs.
For 2027, We will see a major increase in the EGR of 4.97%, but this is down from 5.93% in the 2026 Advance Notice and 9.04% in the 2026 Final Announcement. This growth rate is largely driven by the growth in Original Medicare per capita costs. Utilization and other factors lag a bit in rate-setting. The 2026 and 2027 figures show that utilization is clearly robust. We are seeing more robust utilization and trends in the EGR calculation. This is likely good news for the future as well.
CY 2025 is the base year for most service expenditures for FFS and for MA overall. Based on a recent policy change, in CY 2027 MA-related medical education costs continue to be removed from the historical and projected expenditures supporting the estimates of the 2027 non-ESRD FFS USPCCs.
CMS updates its estimate of each county’s FFS costs using more current FFS claims information. CMS intends to rebase the county FFS rates for 2027 using FFS claims data from 2020 through 2024.
- Rebasing relates to changes in the average geographic adjustment index (GAI), which adjusts for spending differences across regions/counties. This usually has a small impact. The rebasing could be positive or negative in a given year, and actual impacts are really seen at the local county or regional level. The rebasing number simply reflects the nationwide impacts of changes in the GAI. The GAI will be set in the final announcement in April.
- Star revenue changes are a global estimate as well. Each plan will have a different result based on its actual Star performance by contract and eligibility for bonus revenue. The reduction due to Star performance is forecast to be a small -0.03% for 2027. This is largely due to the fact that Star Ratings overall changed little between SY 2025 (PY 2026) and SY 2026 (PY 2027). Remember that there is a one-year lag between the rating year and payment year. Those seeing more changes in Star Ratings between SY 2026 and SY 2027 may see a much bigger year-over-year reduction in revenue. Those maintaining Star could see additional revenue due to enrollment growth. Those gaining bonus revenue for the first time or increasing their ratings would see a jump.
- The coding pattern adjustment is a statutory/regulatory reduction taken to MA rates for the perceived differences in risk adjustment scores between MA and FFS. This gets to the controversy about whether MA plans “over score” members. You know my thoughts on this – it is a bit of a mixed bag in my opinion. The coding intensity adjustment has been set at negative 5.9% for years now and CMS will not change it for 2026. This is despite pressures from critics who say over-reimbursement has risen well beyond that negative factor. But as you will see below, CMS has proposed other ways to address overpayments.
- There is the normalization factor adjustment captured within the Risk Model Revision and Normalization category. The normalization factor ensures the average risk score stays at 1.0 and adjusts from the data year in the model to the payment year. This is different than the coding pattern adjustment. The impact of the update to the normalization factors is not shown separately because there is considerable interaction between the impact of the MA risk adjustment model updates and the normalization factor update. Therefore, the combined impact is shown by CMS. See the next entry below.
- The risk model revisions (2 of them) largely eliminate the EGR. What did CMS do?
Item 1: Additional changes to v28 model (-3.32% with normalization)
CMS is proposing to make updates to the MA risk adjustment model that reflect more current costs associated with various diseases, conditions, and demographic characteristics.
— Use 2023 diagnoses to predict 2024 expenditures instead of 2018 diagnoses predicting 2019 expenditures.
— Use payment year 2024 vs. payment year 2020 for average per capita predicted expenditures to create relative factors in the model.
These changes essentially update years in the model to address emerging differences between MA and traditional FFS coding. The more recent data captures the most recent trends in FFS coding and the update better maintains payment accuracy in MA. Overall, this first item reduces the rate hike by 3.32% with the normalization factor included (1.82% without normalization).
Item 2: Reining in unlinked chart submissions (-1.53%)
— Exclude diagnoses from audio-only services to align with MA diagnosis submission policy.
— Exclude diagnoses that appear in chart reviews (usually manual chart reviews and health risk assessments) but are not supported by corresponding medical encounters from how it calculates risk scores. CMS says MA plans received about $7.5 billion in 2023 for diagnoses that appeared only in risk assessments and related chart reviews but not on a medical encounter.
This second change reduces the rate hike by 1.53%. The agency said plans that rely more heavily on unlinked chart reviews to report risk-adjustment eligible diagnoses will see a greater payment impact. This would be the largest plans out there.
The anticipated risk score trend is 2.54%, a national number calculated by CMS. Individual plans will see various increases or decreases. I noted above that plans and CMS view this trend very differently and why plans do not compute it into the rate hike year-to-year. Like for 2026, the projected risk score trend for 2027 is roughly half of what it was in 2024 and 2025 annually. This is a sign that the new v28 model is changing risk scoring patterns.
Another caution
CMS announced earlier it wants to make a number of reforms to risk adjustment calculations. First, it wants to calibrate the risk adjustment model using MA encounter data (diagnosis, cost, and data submitted to CMS by MA plans). CMS says it could start phasing in an encounter data-based risk adjustment in the future. The issue for plans is it would break with setting rates on what have been traditionally very high FFS program cost trends.
Other financial factors
Other financial changes include:
- Benchmark rate percentages against FFS remain the same at 95% to 115% of FFS in the county.
- The Star bonus remains at the same 5% level and applies only to those with 4 Star ratings or greater.
- The rate rebate percentage — the difference between the plan base bid and the county benchmark which goes back to members via added benefits — remains the same based on Star performance:
- Less than 3.5 Star = 50%
- 3.5 and 4 Star = 65%
- 4.5 and 5 Star = 70%
- No changes to Star calculations for low-enrollment or new plans.
- Part D risk corridors remain the same.
- Given the low rates in Puerto Rico, poverty, and penetration in MA, CMS likely will continue basing the MA county rates in Puerto Rico on the relatively higher costs of individuals in FFS who have both Medicare Parts A and B and applying an adjustment regarding the propensity of individuals with zero claims.
- CMS is proposing updates to the Part D risk adjustment model to reflect Inflation Reduction Act (IRA) changes to the Part D benefit that will be in effect in CY 2027, including an increased manufacturer discount for specified small manufacturers having their discounts phased-in over time as well as calibrating the model using more recent data years (2023 diagnoses and 2024 costs). The updated model also excludes diagnoses from audio-only services and from unlinked charts to be consistent with similar policies proposed for Part C. CMS proposes to improve the model’s predictive accuracy for beneficiaries in MA prescription drug (MA-PD) plans and standalone prescription drug plans (PDPs) by calibrating the model separately for the MA-PD and PDP populations, as well as continuing to calculate separate normalization factors for MA-PD plans and PDPs.
What could change with the Final Announcement in April?
This will be very disappointing to MA plans, but what is likely to happen? As more FFS claims come in, we should see the effective growth rate increase and drive up the EGR. This is dependent on included timeframes, but utilization remains high so something should happen. Last year, the EGR increased by 2.83% between the Advance Notice and Final Announcement. If the same happens in 2027, that would mean the industry gets overall 2.92% — still paltry in a high utilization environment and well below 5.06% in 2026. The administration could offer some relief from the risk adjustment proposals, including abandoning some or phasing them in. But I would not count on this last point.
The impact overall
In the next table, I go further on the troubles MA plans have seen and will see. The industry came off of high annual rate hikes early in the 2020s. In 2024 and 2025, these hikes were basically zeroed out due to the risk model change and low effective growth rates. Compounding the problem was a major drop in Stars starting with 2023 ratings and running so far through 2025 ratings. On the cost side, utilization and other trends (such as drug costs) leapt coming out of COVID. As well, CMS has placed new costly burdens on plans, including requiring them to follow FFS prior authorization processes (I say taking the managed care out of managed care) and new unpaid costs from the Inflation Reduction Act’s (IRA) Part D cost-sharing changes. All this created a perfect financial storm for MA plans. MA plans say they are digging out. They used 2024 (to some degree) as well as 2025 and 2026 to right the financial ship. But the 2027 rate news, even with an uptick in the final announcement, likely means further geographic, product, and benefit contraction in 2027.
| Medicare Advantage’s Rocky Stars, Rates, and Medical Expense Road | ||||||
| 2022 | 2023 | 2024 | 2025 | 2026 | 2027 | |
| Star scores (score impacts the following calendar year revenue) | Very High (impacts 2023 revenue) | Scores dropping — first year of recent drop (impacts 2024 revenue) | Scores low – second year of recent drop (impacts 2025 revenue) | Scores low – third year of recent drop (impacts 2026 revenue) | Scores low – marginally higher than 2025 (impacts 2027 revenue) | TBD – to be announced in October 2026 (impacts 2028 revenue) |
| Rates | Very High | High | Low | Low | Somewhat Low | Low (based on Advanced Notice) |
| Medical Expense | Rising | Rising | High | High | High | High |
So, for years, strong margins in MA were supported by somewhat aggressive overall (and very aggressive for some plans) risk adjustment practices that drove coding intensity. CMS is now making it clear that such arbitrage strategies will not be countenanced. That started with the 3-year phase-in of v28 and continues with the new proposals in the Advance Notice for 2029. CMS will likely ensure that data is updated often to take away any advantage MA plans have from lagging coding practices in FFS. The chart review change impacting health risk assessments and retrospective manual chart review documentation is fair and impacts the bigger plans that practiced the most aggressive risk adjustment strategies. A recent HPMS memo from CMS says it will proceed on risk adjustment data validation (RADV) audit expansions, despite the RADV rule being struck down. But the agency is appealing and wants to undertake aggressive RADV audits as yet another check on perceived overpayments in the program. It could publish a new rule quickly if it is unsuccessful on appeal.
Compounding these revenue impacts is the proposal for Star changes, which eliminates easy-to-hit operational measures and other measures that have shown little variability between plans over the years. The changes fully roll out in SY 2029 and will mean overall ratings drop on average 0.15 to 0.25 Stars. About 25% to 30% of contracts lose a half Star rating. The changes, too, make it more difficult to hit the critical thresholds of 3.5 and 4.0 Stars for additional revenue. Over 100 contracts fall below their current 3.5 and 4.0 Star ratings. The operations measures were almost a quarter of the overall rating and the changes move weighting to medical and drug measures (46%) as well as survey measures (39%).
So, in the end, MA plans will need to move from the easy to hit Stars measures and risk adjustment games to real clinical value (quality and care management) and lower overall medical costs.
A silver lining
While it is quite possible that Congress takes more action on overpayments, all the activities of the past few years and those in the Advance Notice seems to be taking overpayments out of the MA rate system. Congressional Medicare policy arm MedPAC and other opponents continue to beat the drum on MA overpayments but are using old data to do so.
A recent analysis by CMS sought to apply the v28 model to 2022 data and found a 1.5% to 2.0% “uncorrected” coding in MA vs. original Medicare. Too, the advent of AI and other technologies have helped providers better close some of the gaps between traditional FFS coding and legitimate MA coding. The updated years in the model drive down differences as well. I will cover these topics in detail in a coming blog. The industry needs to ensure the data timing is not lost on Congress before any aggressive actions on overpayments are taken.
#medicareadvantage #cms #rates #stars #quality #riskadjustment #radv #overpayments
— Marc S. Ryan